MLFlow experiment tracking, complete tutorial.
Aug 17, 2025
What is MLflow experiment tracking?
One inevitable part of the daily work of a Data Scientist is to build ML models. However, you rarely come up with a good model from the very beginning. Usually, creating a good model takes a lot of effort and experiments.
In my career, I have conducted thousands of experiments, if not tens of thousands. And a very common issue with experiments is that you quickly get lost in them.
What was the feature setup that gave me the best score? Did I scale data for that experiment? What were the resulting hyperparameters? What about the search space that I used for the learning rate? Do I even remember what the score was?
These questions appear all the time. You have been there, you are not alone, trust me.
How do I know?
I know because if there is a problem, usually there is a solution. And there is a solution created for experiment tracking. In fact, there are many of them.
The most common framework/library for experiment tracking (and the full model management lifecycle) is MLflow. It was one of the first tools (maybe even the first one) in the community that aimed to solve problems with experiment tracking and ML model management.
In this article, we will learn what MLflow is, what components it has, and how to start using MLflow for tracking ML experiments. In the following articles, we will also consider how to select the best models from these experiments and push them to a Model Registry from which you can then serve models to the inference stage of your ML pipelines.
Main components of MLflow experiment tracking
MLflow tracking is a component of the MLflow framework that is responsible for logging parameters, code versions, metrics, and output files when running your machine learning code and for later visualizing the results. MLflow Tracking lets you log and query experiments using Python, REST, R API, and Java API APIs.
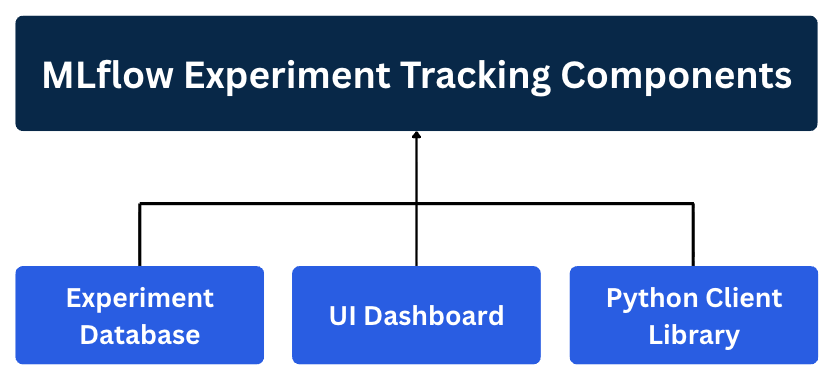
In general, the MLflow tracking system can be split into 3 main components:
1. The Database (Experiment Memory)
This is where all your experiment metadata gets stored. It's usually a local file system or a cloud-based database that can handle structured data (metrics, parameters) and unstructured data (images, model files, plots).
2. The Client Library (Logging Python Library)
This is the Python library you integrate into your training code. It's what actually sends your experiment data to the database.
3. The Web Dashboard (User Interface)
This is the web interface where you visualize, compare, and analyze all your experiments. This component makes it convenient to take a closer look at your result and draw conclusions about which parameters or models are best to choose for the deployment and what the general parameter trend is with respect to the model accuracy.
What exactly does MLflow store?
There are 2 main data types that MLflow stores:
1. MLflow entities - model parameters, metrics, tags, notes, runs, metadata. The entities are stored in a so-called backend store.
2. Model artifacts - model files, images, plots, etc. The articles are stored in artifact stores.
The way these 2 data object types are stored and the Python Client library is used can be different. The MLflow documentation describes 6 main scenarios.
In this article, we will cover the 2 most common ones (Scenario 3 and 4 in the documentation). Reading the documentation can be useful, but below we will make things more clear that are described in the documentation, so please, follow along!
Scenario 1 (Scenario 3 in docs) - MLflow on localhost with Tracking Server
In this scenario, a Data Scientist stores locally in the machine on which he runs the code. The figure below schematically shows this approach.
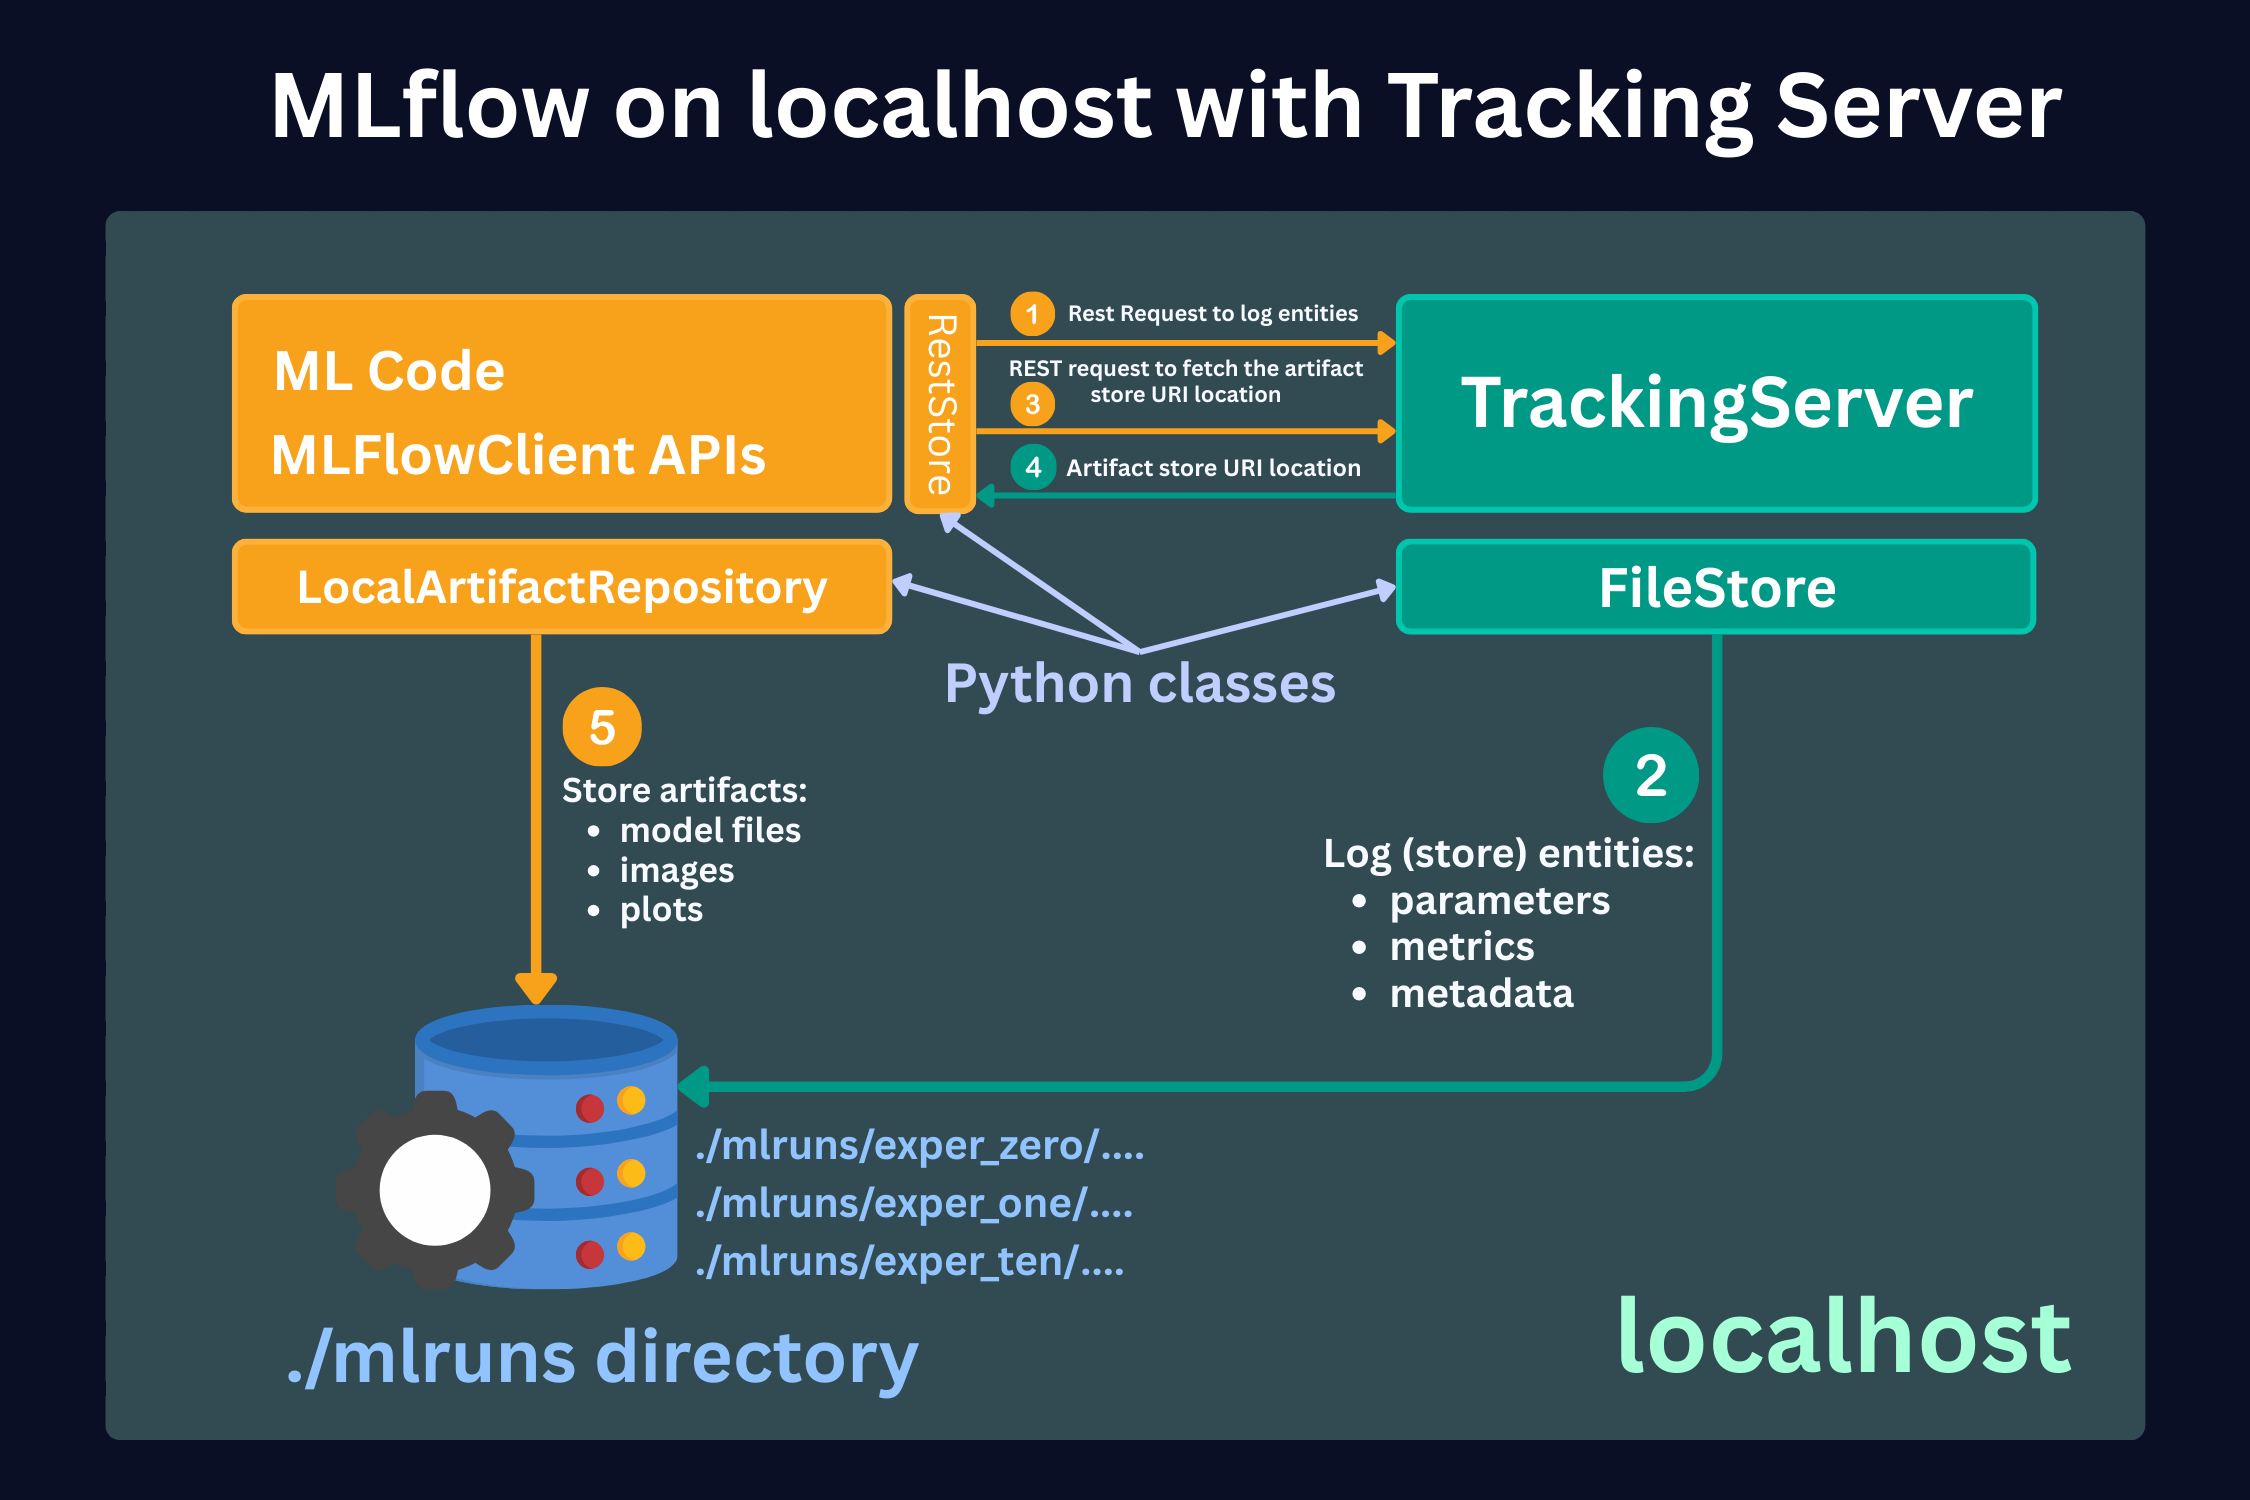
Here, we see 3 main parts:
1. ML code and MLFlowClient APIs (yellow box).
This is where you run your code and make experiments. Here, using MLFlow Library Python Class RestStore, you communicate with a Tracking Server (more on it below), which tells you what the URI (Uniform Resource Identifier, e.g., users:/alex/mlruns/) is where the artifacts are stored. In case of storing it locally, this will be a folder somewhere on your machine. By default, this is the folder ./mlruns in the directory where you run your code.
When the MLFlowClient gets this information, it then uses the LocalArtifactRepository class to store the artifacts (files) in this directory (blue database image).
2. Tracking Server (green box).
Tracking Server is a running process on your local machine (by the way, you can see that all the boxes are inside a green shadow box, which describes localhost - your local machine). This Server (process) communicates with the MLFlowClient through REST requests (as described above) to supply the required information for the artifact storage.
What it also does is that it uses FileStore Python class to store the entities (parameters, metrics, metadata, etc.) in the local storage directory (mlruns folder).
3. Local Data Store (blue database icon)
In this scenario, this is just your local directory, which is by default created in the directory where you run your code. Here, the folder mlruns is created, where both artifacts (models) and entities (metadata) are stored.
What is a typical use case for this setup?
This setup is often used when you run their experiments locally and do not bother with sharing the results with their team members. Also, in this case, you need to set up a separate process to send the resulting model to the deployment infrastructure. In the worst case, you can also upload the model manually.
Pros:
- Quick setup, no infrastructure required
- User does not need any knowledge of the remote storage setup
Cons:
- Hard to share results with other team members
- Hard to deploy the models that are selected based on experimentation.
Scenario 2 (Scenario 4 in docs) - MLflow with remote Tracking Server, backend, and artifact stores
In this case, you still run your experiments locally. However, the Tracking Server, the artifact store, and the backend store are running on remote servers, e.g., on AWS.
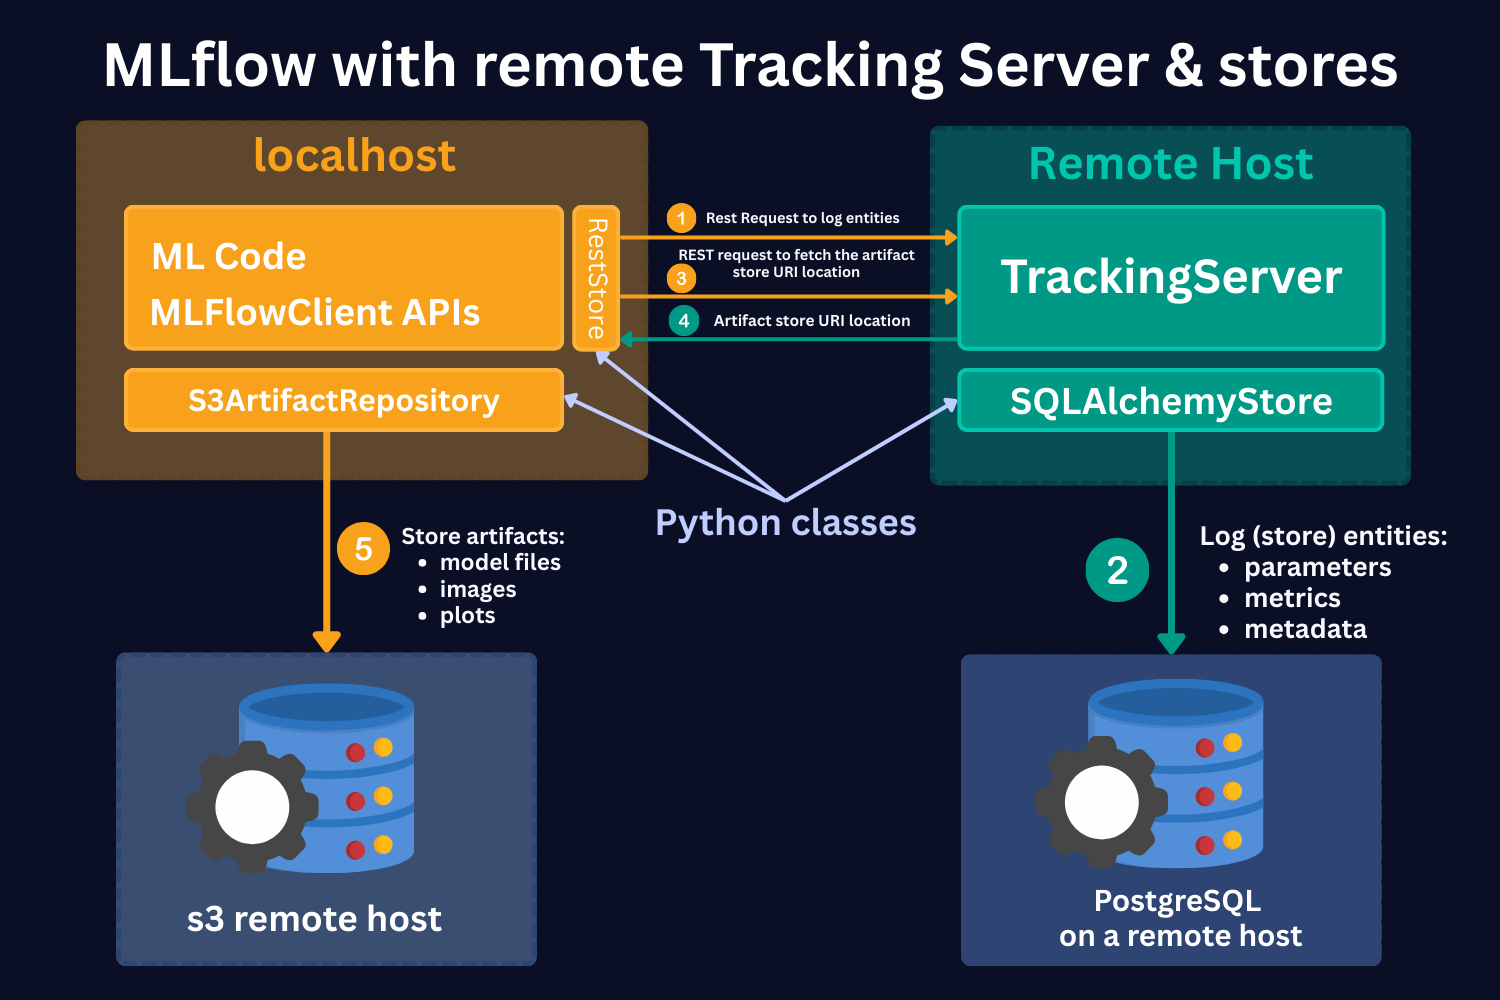
Here, we see the same 4 main parts:
1. ML code and MLFlowClient APIs (yellow box).
As in the local case, here, using MLFlow Library Python Class RestStore, you communicate with a Tracking Server (more on it below), which tells you what the URI (Uniform Resource Identifier, e.g., users:/alex/mlruns/) is where the artifacts are stored.
However, in this case, you store artifacts on the S3 remote host. Note that it's not necessarily an S3 store. It can be any other remote storage location, for instance, Azure Blob storage.
In case of S3 bucket storage, MLflow uses the s3ArtifactRepository class to store artifacts.
2. Tracking Server (green box).
Tracking Server is a running process on a remote host. This Server (process) communicates with the MLFlowClient through REST requests (as described above) to supply the required information for the artifact storage.
It also stores the mlruns entities. However, in this case, it uses the SQLAlchemyStore class. to communicate with SQL-like remote databases, for instance, PostgreSQL.
3. S3 remote host Data Store (left-hand side blue database icon).
This is a remote store for mlruns artifacts. As mentioned, this should not necessarily be S3 buckets. It can be any remote/cloud-based storage system.
4. PostgreSQL remote host Data Store (right-hand side blue database icon).
This is a remote storage for mlruns entities. This is an SQL-like database, for instance, PostgreSQL or SQLite.
Hands-on Exercise
Hands-on exercise will be published in the next newsletter issue.