Reading time - 7 mins
🥇 Picks of the Week
Library for torch, Data Drift Importance, ML Interview & ML Quiz Questions, and more.
🧠 ML Section
Begin using SHAP values for feature selection (with code example).
💰 ML Section
Learn the TOP 3 CV Mistakes and how to avoid them
Together with datainterview.com
Become 100% ML Interview Ready. Now.
DataInterview.com helps you finally nail ML Interviews with ease.
- Created by FAANG DS & ML Engineers
- 100 FAANG SQL questions, 40 business case solutions
- 6+ Hours Mock Interview Recordings
- DS Coding Question Bank
- Lifetime Access to Slack Study Group and more
🔥 Get 10% OFF with code TIMURCOURSE
Nail your ML Interview with ease!
1. ML Picks of the Week
⏱ All under 60 seconds. Let’s go 👇
🥇 ML Tool
→ Use torchinfo to make a crystal clear PyTorch model summary like in Keras.
📈 ML Concept
→ Three practical cases of how Data Drift ruins your production.
🤔 ML Interview Question - What is PCA?
One-line answer: PCA reduces dimensionality by converting correlated features into uncorrelated components that preserve maximum variance.
Learn PCA more deeply for daily use and interviews.
🗞️ One AI News
OpenAI has released GPT-4.1 in ChatGPT. Claimed to be better for coding tasks.
🧠 Quiz. Can you answer without GPT?
→ What does the ROC curve plot?
A) Precision vs. Recall
B) F1 Score vs. Accuracy
C) True Positive Rate vs. False Positive Rate
D) Loss vs. Epochs
✅ See the correct answer here
2. Technical ML Section
Intro to Feature Selection with SHAP
(The full code is available here)
There is a misconception that the more features you generate, the better your model is.
This is 100% wrong.
In practice, when you deploy and monitor your model, it's way better to have as few features as possible. Even if the model accuracy is a bit worse.
In this issue, we will see how SHAP values can help us understand the model predictions better as well as select features.
This is an introductory tutorial, and you will see SHAP values in upcoming issues a lot more.
What is SHAP?
SHAP (SHapley Additive exPlanations) is a unified framework based on game theory to explain the output of any machine learning model.
To fully understand how SHAP values work, please check this breakdown.
For this tutorial, we need to know that the SHAP framework identifies how each feature contributes to the difference between the model’s prediction and a baseline value.
Typically, the baseline value is the mean model output across the dataset.
Each SHAP value represents the marginal contribution of a feature, averaged across all possible feature permutations.
It provides a global understanding (via summary plots) and local explanations (per-instance feature attribution) with strong theoretical guarantees.
Let's see how we can use it for feature selection in practice.
1️⃣ Data and libraries
The main library that is used for SHAP values in ML is called shap. We import it together with the required sklearn modules.
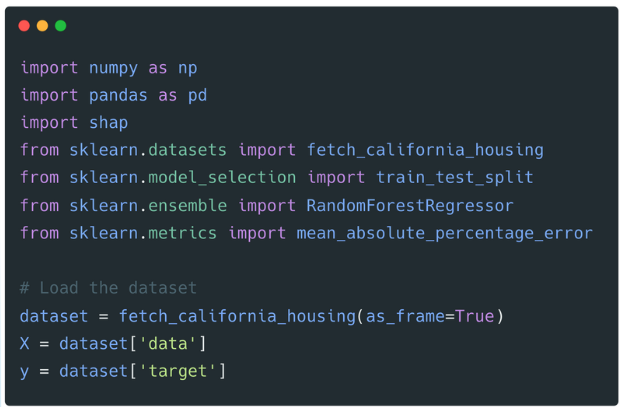
For the dataset, we will use the California housing dataset.
The target value is MedHouseVal – Median house value for California districts (in hundreds of thousands of dollars).
These are the features:
-
MedInc – Median income in block group (in tens of thousands of dollars)
-
HouseAge – Median age of houses in the block group
-
AveRooms – Average number of rooms per household
-
AveBedrms – Average number of bedrooms per household
-
Population – Total population in the block group
-
AveOccup – Average number of household members
-
Latitude – Geographical latitude of the block group
-
Longitude – Geographical longitude of the block group
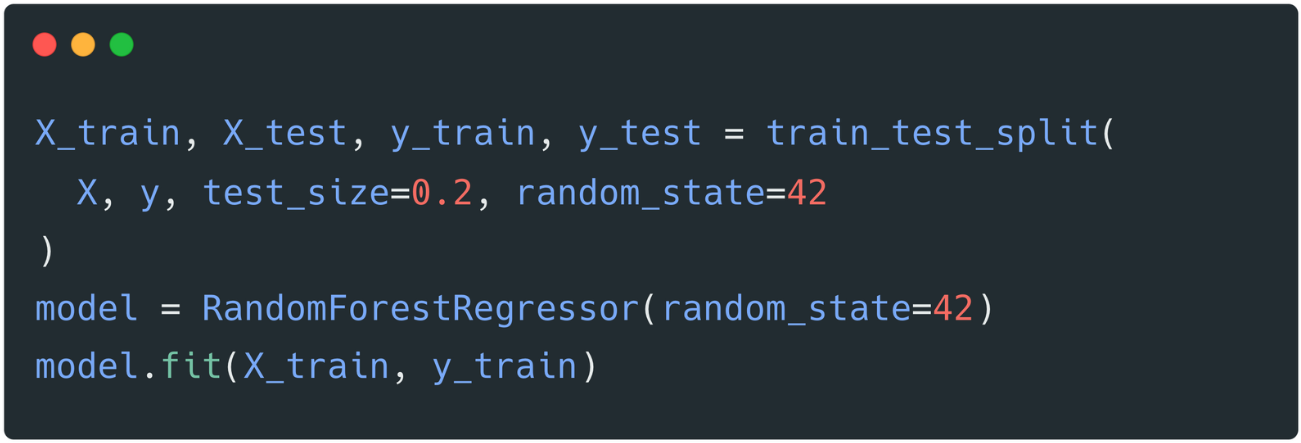
2️⃣ Prepare the data and fit the model
We just split the data into the train and test without any feature engineering for illustrative purposes.
We’ll use Random Forest to avoid tedious hyperparameter tuning.
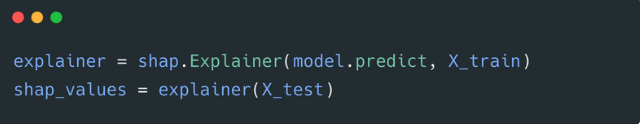
3️⃣ Create an explainer object and calculate SHAP values on the test set
A SHAP Explainer is an object that connects your trained model with SHAP’s explanation algorithms.
It acts as a wrapper that understands how your model makes predictions and enables SHAP to compute per-feature contribution scores (SHAP values) for any input.
Depending on your model type, SHAP will automatically choose the most efficient explainer:
-
TreeExplainerfor tree-based models (e.g. XGBoost, LightGBM) -
LinearExplainerfor linear models -
KernelExplainerfor black-box models
To compute that baseline, SHAP needs a representative distribution of feature values. That’s why we use the training data when initializing the explainer:
-
The model was trained on this data, so it reflects what the model has actually learned.
-
Using training data avoids data leakage — we don’t contaminate the test set with anything used during interpretation.
-
SHAP needs to simulate different feature combinations when calculating marginal contributions. The training data provides realistic feature correlations and value ranges to simulate from.
Then, once the explainer is built, we apply it to the test set to compute SHAP values.
This ensures we're interpreting the model's behavior on unseen data, giving us a faithful understanding of how the model generalizes and makes decisions in production-like conditions.
4️⃣ Check the most important features by the absolute SHAP values
Now, we can check which values are the most important (have the highest SHAP values).

This gives us the following dataframe.
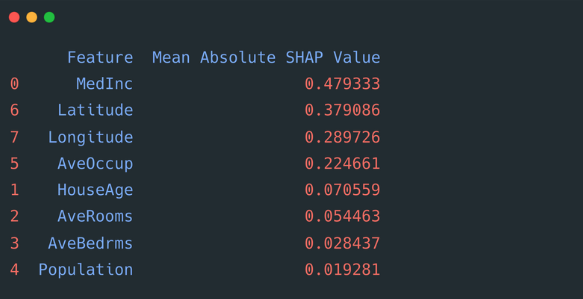
From here, we see that the Median Houshold Income corresponds to the increase in the house price. As well as the Household location.
On the other hand, the household population has the lowest SHAP values.
This is a simple dataset, and you do not need to have a strong domain expertise to see if the outcome makes sense.
However, industrial datasets are much more complex, and combining your domain expertise with the SHAP output creates huge value for the delivered model.
SHAP goes way beyond just pure value numbers, and we will see one of the examples later.
For now, we take the values only and select the TOP features based on them.
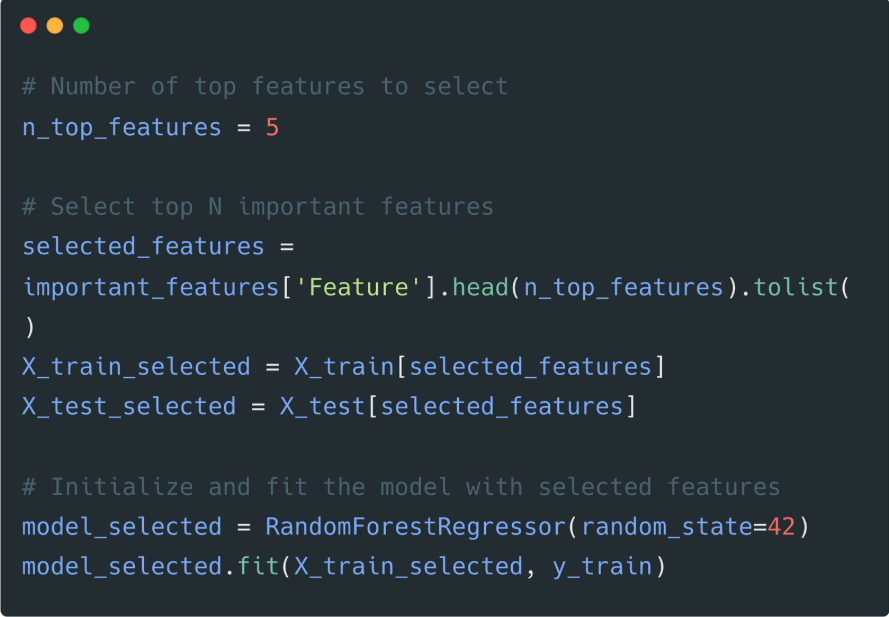
5️⃣ Specify the number of selected features and re-fit the model
We will select the TOP 5 features out of 8 and re-fit the model.
6️⃣ Compare performance with all and selected features
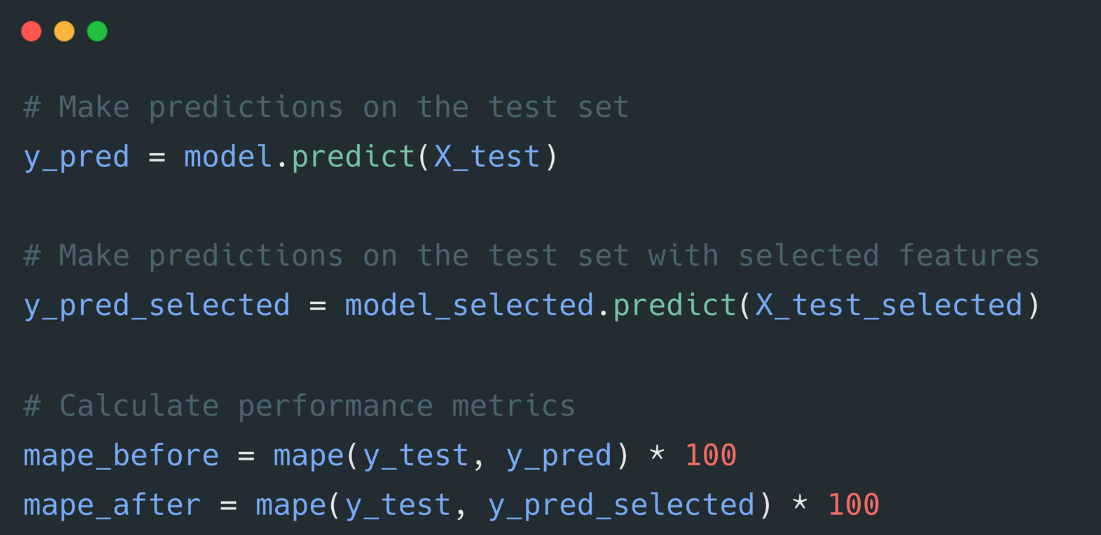
In this simple case, the performance hasn’t degraded!
We've got:
- MAPE before: 18.92%
- MAPE after: 18.25%
Summary
Of course, this is an intro tutorial, but you can start using it right away.
Some takeaways:
- Aim for fewer features in practice. Rule: Less is more
- SHAP is a framework to quantify and explain feature contributions to ML models
- Using SHAP values, we can select best best-performing features
That's it for the Technical Part!
Follow me on LinkedIn for more daily ML breakdowns.
2. ML Career Section
TOP 3 Mistakes of ML/DS Resumes
Mistake #1: Listing Responsibilities Instead of Achievements
❌ Weak Example (just responsibilities):
Built machine learning models for sales forecasting using XGBoost.
✅ Use the XYZ formula instead:
Increased monthly revenue by 3.5% by deploying an XGBoost model that reduced MAPE by 8% for sales forecasting.
Mistake #2: No Context or Problem Scale
❌ Weak Example (no context):
Built classification models for customer churn prediction.
✅ Strong Example (with context & scale):
Built and deployed 3 churn models for a telecom client with 10M+ users, improving retention by 4%.
Mistake #3: Weak or No Summary Section
❌ Weak Example:
Data Scientist passionate about solving business problems with ML.
✅ Strong Example:
-
3+ years of experience in building and deploying ML systems for retail and logistics.
-
Delivered 8 production models used by non-technical stakeholders to drive pricing and demand decisions.
-
Improved forecast accuracy by 12%, leading to ~$200K/year in savings.
🎯 Why this matters: Your summary is scanned in 7–10 seconds. Use bullet points, bold key numbers, and skip the fluff.
That is it for this week!
If you haven’t yet, follow me on LinkedIn where I share Technical and Career ML content every day!
Whenever you're ready, there are 3 ways I can help you:
1. ML Job Landing Kit
Get everything I learned about landing ML jobs after reviewing 1000+ ML CVs, conducting 100+ interviews & hiring 25 Data Scientists. The exact system I used to help 70+ clients get more interviews and land their ML jobs.
2. ML Career 1:1 Session
I’ll address your personal request & create a strategic plan with the next steps to grow your ML career.
3. Full CV & LinkedIn Upgrade (all done for you)
I review your experience, clarify all the details, and create:
- Upgraded ready-to-use CV (Doc format)
- Optimized LinkedIn Profile (About, Headline, Banner, and Experience Sections)
Join Maistermind for 1 weekly piece with 2 ML guides:
1. Technical ML tutorial or skill learning guide
2. Tips list to grow ML career, LinkedIn, income